Issue Insights
The INSIGHTS tab of Issues shows how your issues develop: how many you resolve, how many come back, how they split by severity, state and category, which assets have the most, and how long fixes take.
Before You Start
- Package: External Attack Surface Management (EASM).
- Role: Admin or Member.
Where to Find It
Sidebar: EXTERNAL ATTACK SURFACE MANAGEMENT › ISSUES · Tab: INSIGHTS · https://platform.deepinfo.com/app/easm/issues/insights
Read the Screen
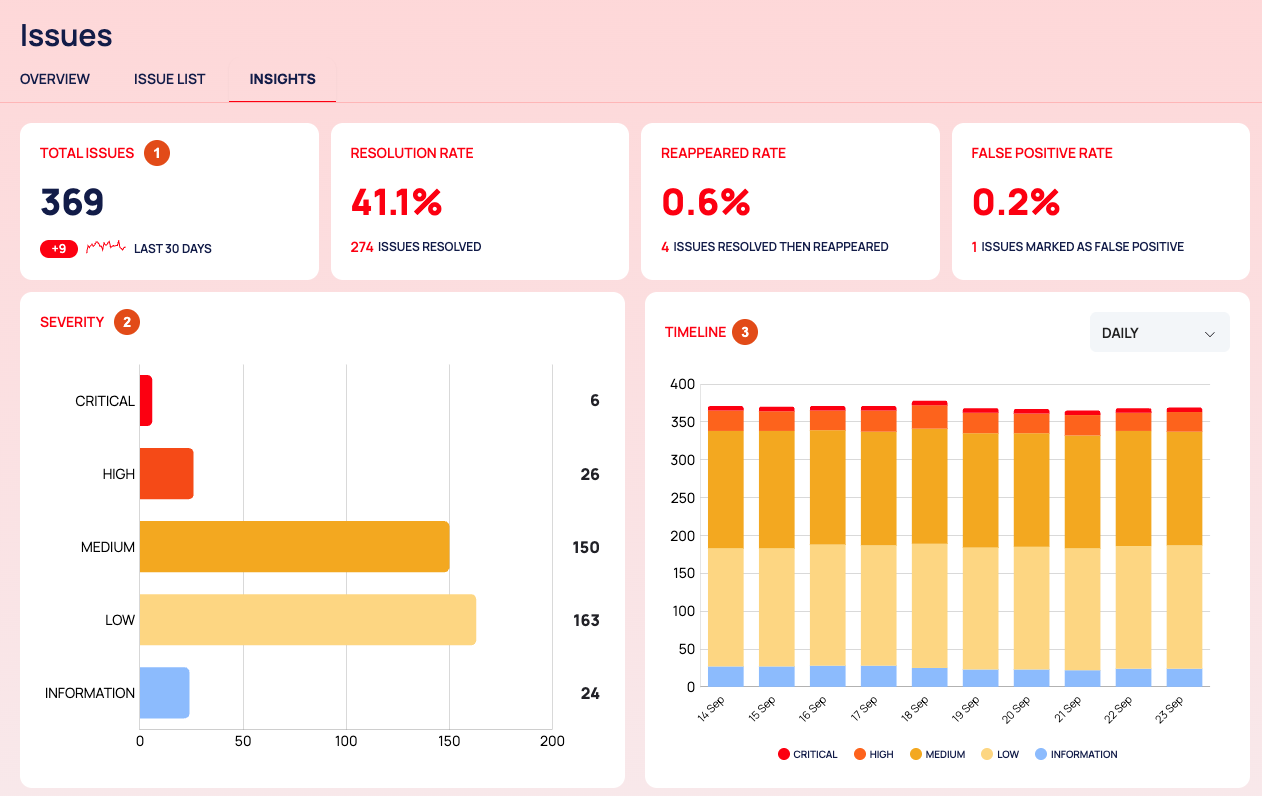
Cards:
Card What it shows TOTAL ISSUES Your active issues, with the change over the LAST 30 DAYS RESOLUTION RATE The share of your issues that are resolved, with the number of issues resolved REAPPEARED RATE The share of your issues that were resolved and then came back FALSE POSITIVE RATE The share of your issues marked as false positives SEVERITY: your issues per severity.
TIMELINE: issues per severity over time, with a legend for CRITICAL, HIGH, MEDIUM, LOW and INFORMATION. Choose the interval in the dropdown.
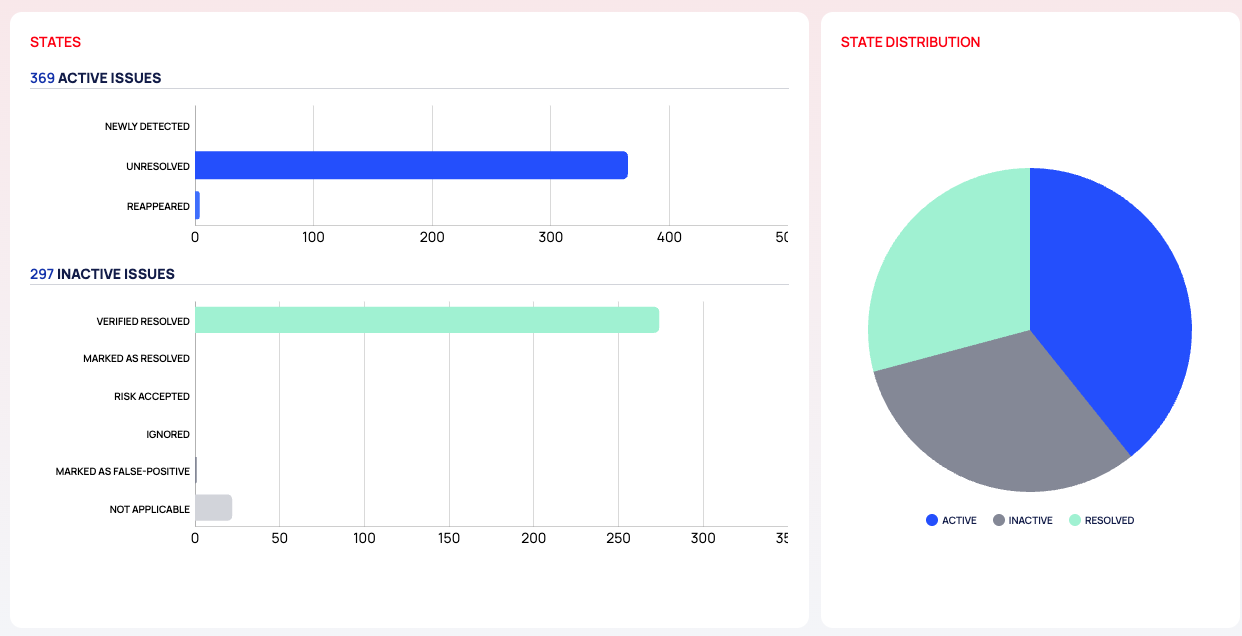
STATES: two charts, ACTIVE ISSUES and INACTIVE ISSUES, broken down by state.
STATE DISTRIBUTION: a pie of ACTIVE, INACTIVE and RESOLVED. See Good to Know before you read it.
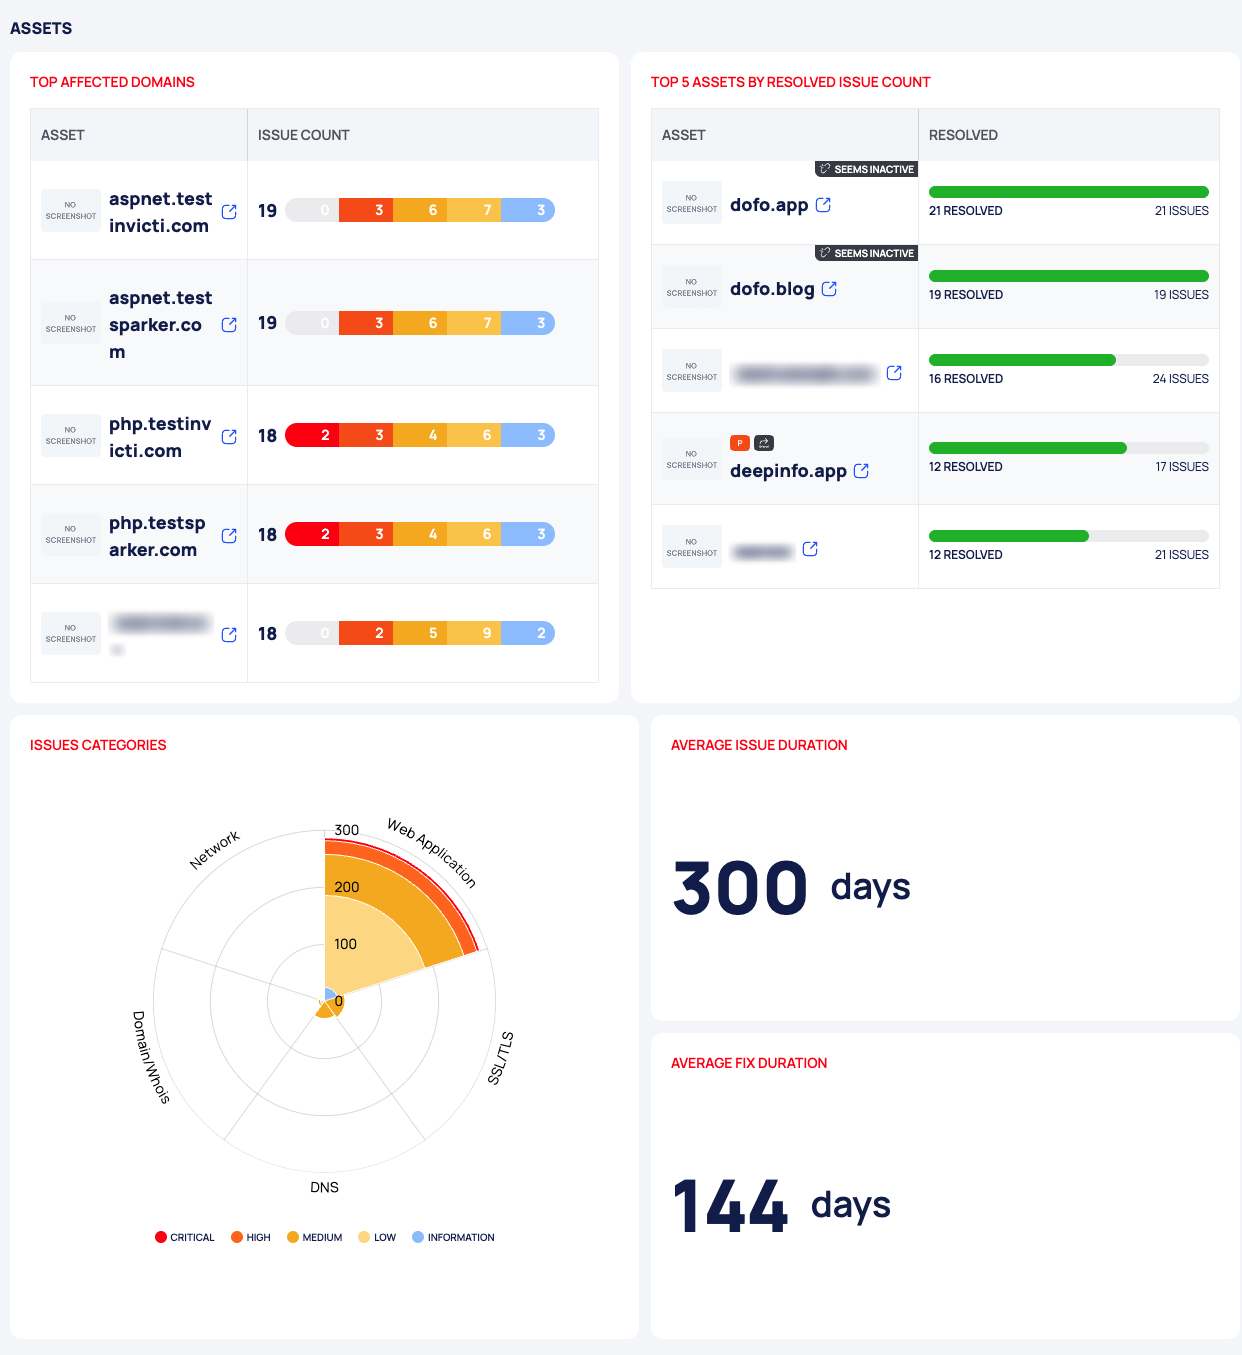
ASSETS:
- TOP AFFECTED DOMAINS: the assets with the most active issues, with ASSET and ISSUE COUNT (the total and the count per severity).
- TOP 5 ASSETS BY RESOLVED ISSUE COUNT: with ASSET and RESOLVED, shown as resolved issues out of all issues on the asset. An asset can carry the SEEMS INACTIVE ribbon.
ISSUES CATEGORIES: issues per category, broken down by severity.
AVERAGE ISSUE DURATION and AVERAGE FIX DURATION, in days.
Use the Page
- Measure progress: watch RESOLUTION RATE rise and AVERAGE FIX DURATION fall over the weeks.
- Catch regressions: a rising REAPPEARED RATE means fixed issues are coming back. To list them, untick GROUP BY ISSUE TYPES on ISSUE LIST and filter STATE for Active - Reappeared.
- Check your triage: a high FALSE POSITIVE RATE is worth a look. To list those issues, untick GROUP BY ISSUE TYPES on ISSUE LIST, tick SHOW INACTIVES and filter STATE for Inactive - Marked As False Positive.
- Choose where to work: TOP AFFECTED DOMAINS shows the assets with the most active issues. Select a row to open the asset.
States, Colors and Scores
| Figure | Counts | Out of |
|---|---|---|
| TOTAL ISSUES | Active issues | Not a rate: the count itself |
| RESOLUTION RATE | Resolved issues | All issues, active and inactive |
| REAPPEARED RATE | Issues in the state REAPPEARED | All issues, active and inactive |
| FALSE POSITIVE RATE | Issues in the state MARKED AS FALSE POSITIVE | All issues, active and inactive |
For what each state means, see Change the state of issues and vulnerabilities.
Good to Know
- STATE DISTRIBUTION can count resolved issues twice. The RESOLVED slice can also be included in INACTIVE, so the three slices can add up to more than your number of issues. For the plain split between active and inactive issues, use STATES.
- TOTAL ISSUES counts active issues only, while the three rates are shares of all your issues, active and inactive.
- The page is for reading only. It has no filters and no export.
- The Issues OVERVIEW tab has more summary cards; see Triage issues.
Do This With the API
- Issues per severity: Issue Severity Stats
- Issues per state: Issue State Stats
- Average issue and fix durations: Issue Duration Stats
- Issues per category: Issue Category Stats
- Issues per severity over time: Issue Severity Stats Timeline