EASM Dashboard
The External Attack Surface Management (EASM) dashboard summarizes your attack surface on one page. Use it to spot what needs attention, then open the full list from the section it belongs to.
Before You Start
- Package: EASM.
- Role: Admin or Member.
- Data: at least one asset. With an empty inventory, the platform opens Add assets instead.
Where to Find It
Sidebar: EXTERNAL ATTACK SURFACE MANAGEMENT › EASM DASHBOARD · https://platform.deepinfo.com/app/easm/dashboard
From the Global dashboard, the EASM card and GO TO EASM DASHBOARD open it too. The page title reads External Attack Surface Management Dashboard.
Read the Screen
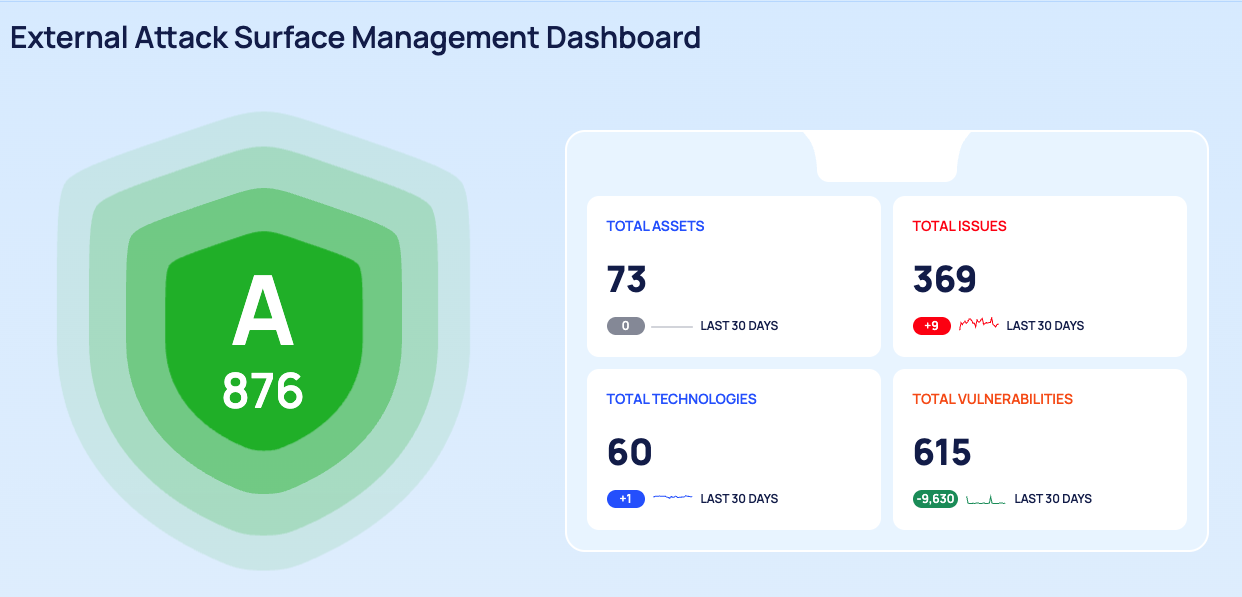
The page has a summary at the top and four sections below it, in this order.
- Score dial and totals. The dial shows your organization's security grade and score. Next to it are four cards: TOTAL ASSETS, TOTAL ISSUES (active issues only), TOTAL TECHNOLOGIES and TOTAL VULNERABILITIES. Each shows the total, a change chip, a trend line and LAST 30 DAYS. Select a card to jump to its section.
- ASSETS, with the GO TO ASSETS PAGE button.
- ISSUES, with the GO TO ISSUES PAGE button.
- TECHNOLOGIES, with the GO TO TECHNOLOGIES PAGE button.
- VULNERABILITIES, with the GO TO VULNERABILITIES PAGE button.
The change chip shows how much the value changed over the last 30 days, for example +12, -3 or 0. After a
sharp drop, the decrease can be larger than the current total.
Rows in the top lists open the matching detail page in a new browser tab. In the asset tables, the link icon next to a name opens the live site in a new tab. The GO TO … buttons open their page in the same tab.
ASSETS
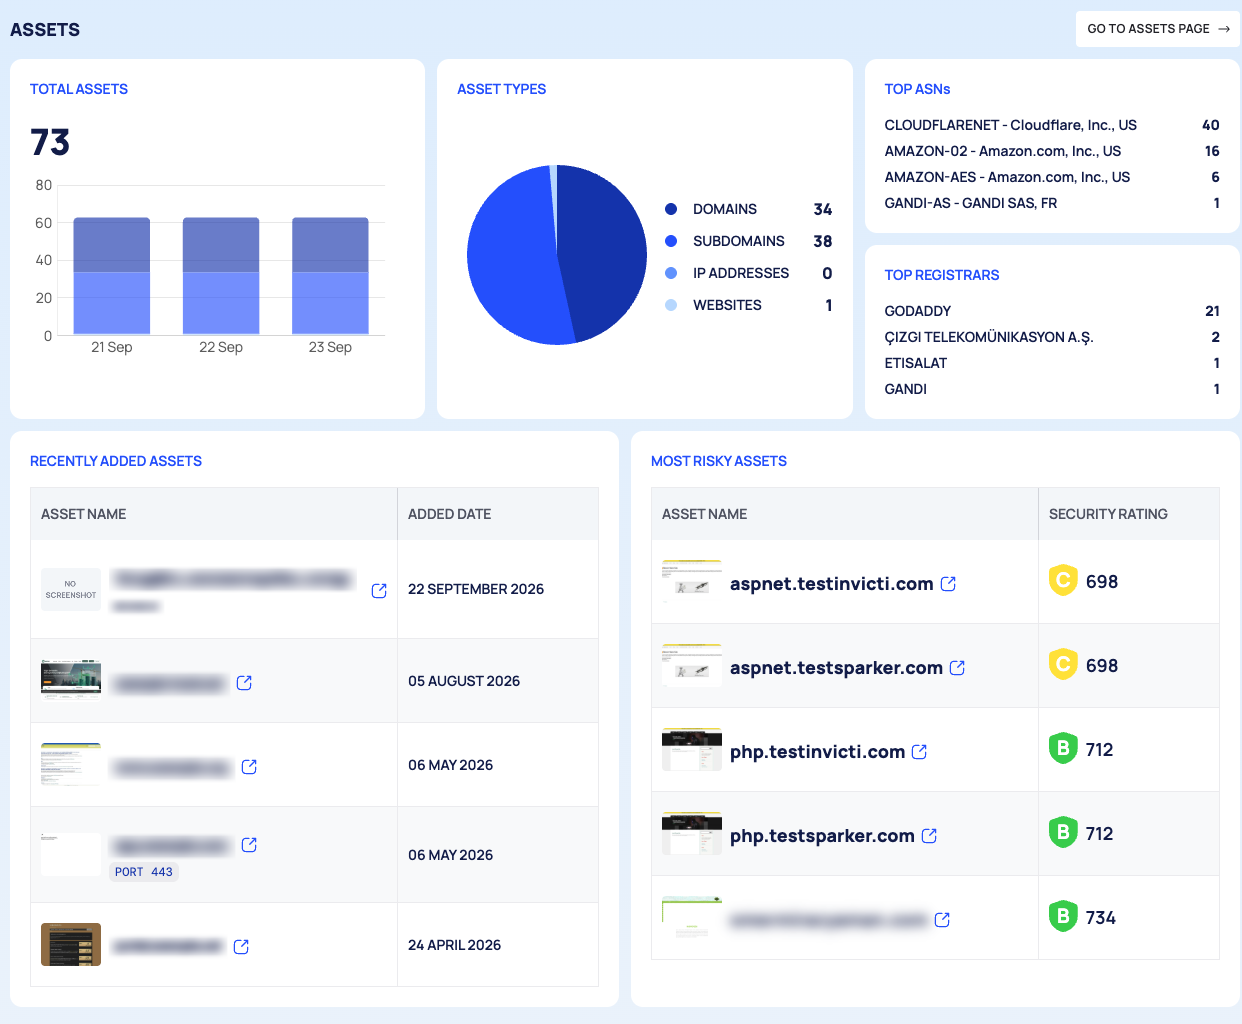
| Card | What it shows |
|---|---|
| TOTAL ASSETS | Number of assets |
| ASSET TYPES | DOMAINS, SUBDOMAINS, IP ADDRESSES and WEBSITES, with the count of each |
| TOP ASNs | Your subdomains grouped by network (ASN) |
| TOP REGISTRARS | Your domains grouped by WHOIS registrar |
| RECENTLY ADDED ASSETS | The newest assets: ASSET NAME and ADDED DATE |
| MOST RISKY ASSETS | The assets with the lowest security score: ASSET NAME and SECURITY RATING |
GO TO ASSETS PAGE opens Inventory. A row opens that asset's detail page, described in Investigate an asset.
ISSUES
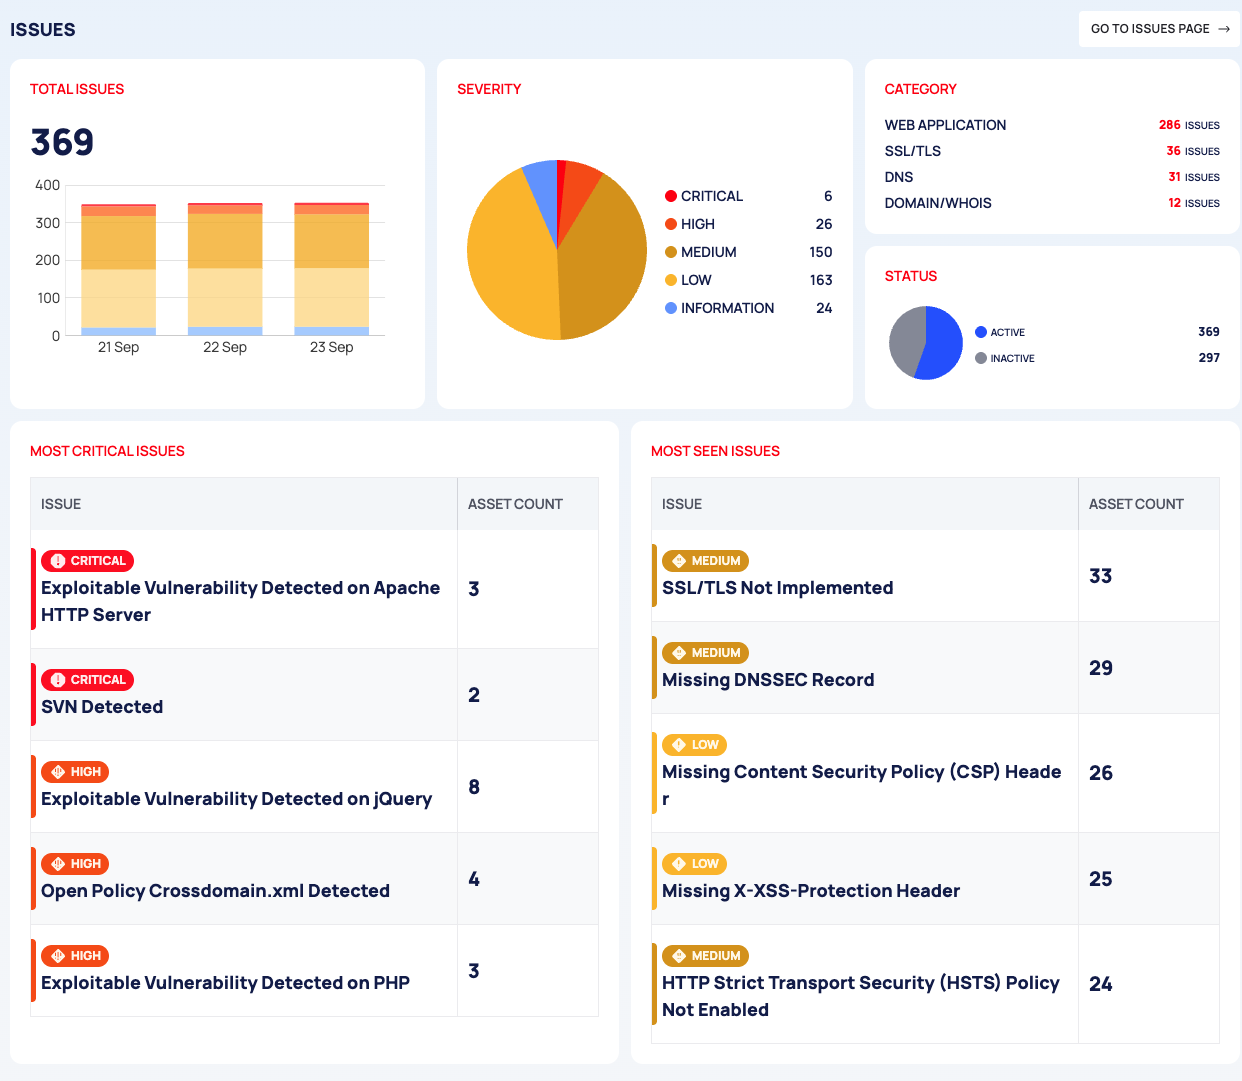
| Card | What it shows |
|---|---|
| TOTAL ISSUES | Number of issues |
| SEVERITY | Issues per severity, from CRITICAL to INFORMATION |
| CATEGORY | Issues per category |
| STATUS | ACTIVE and INACTIVE issues |
| MOST CRITICAL ISSUES | Issue types ranked by severity and then by the number of affected assets: ISSUE and ASSET COUNT |
| MOST SEEN ISSUES | The issue types that affect the most assets: ISSUE and ASSET COUNT |
GO TO ISSUES PAGE opens the Issue List. A row opens that issue type's page.
TECHNOLOGIES
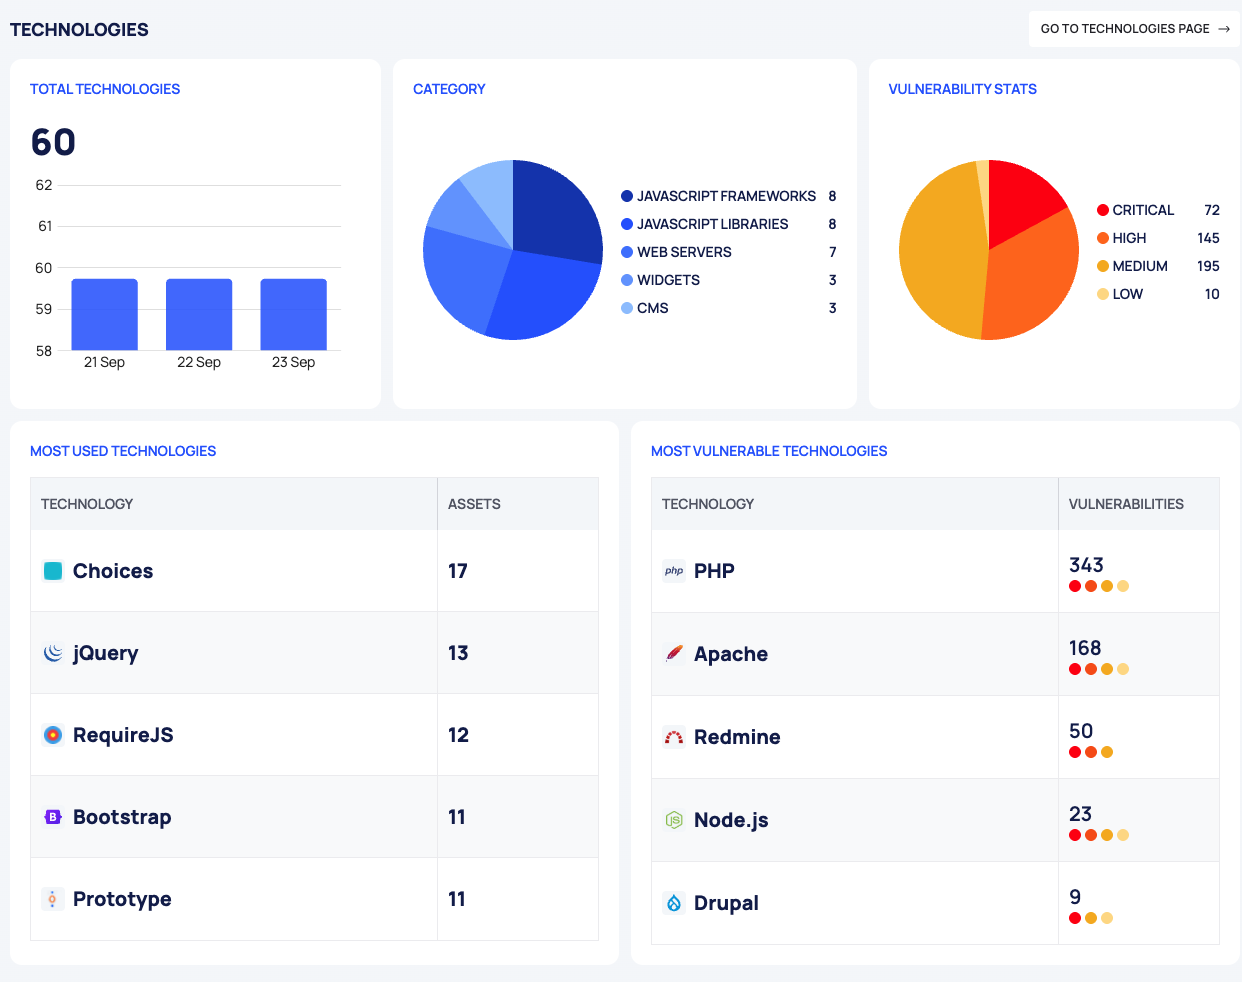
| Card | What it shows |
|---|---|
| TOTAL TECHNOLOGIES | Number of detected technologies |
| CATEGORY | The largest technology categories |
| VULNERABILITY STATS | The technologies' vulnerabilities per severity |
| MOST USED TECHNOLOGIES | TECHNOLOGY and the number of ASSETS that run it |
| MOST VULNERABLE TECHNOLOGIES | TECHNOLOGY and its number of VULNERABILITIES |
GO TO TECHNOLOGIES PAGE opens the technology list. A row opens that technology's page.
VULNERABILITIES
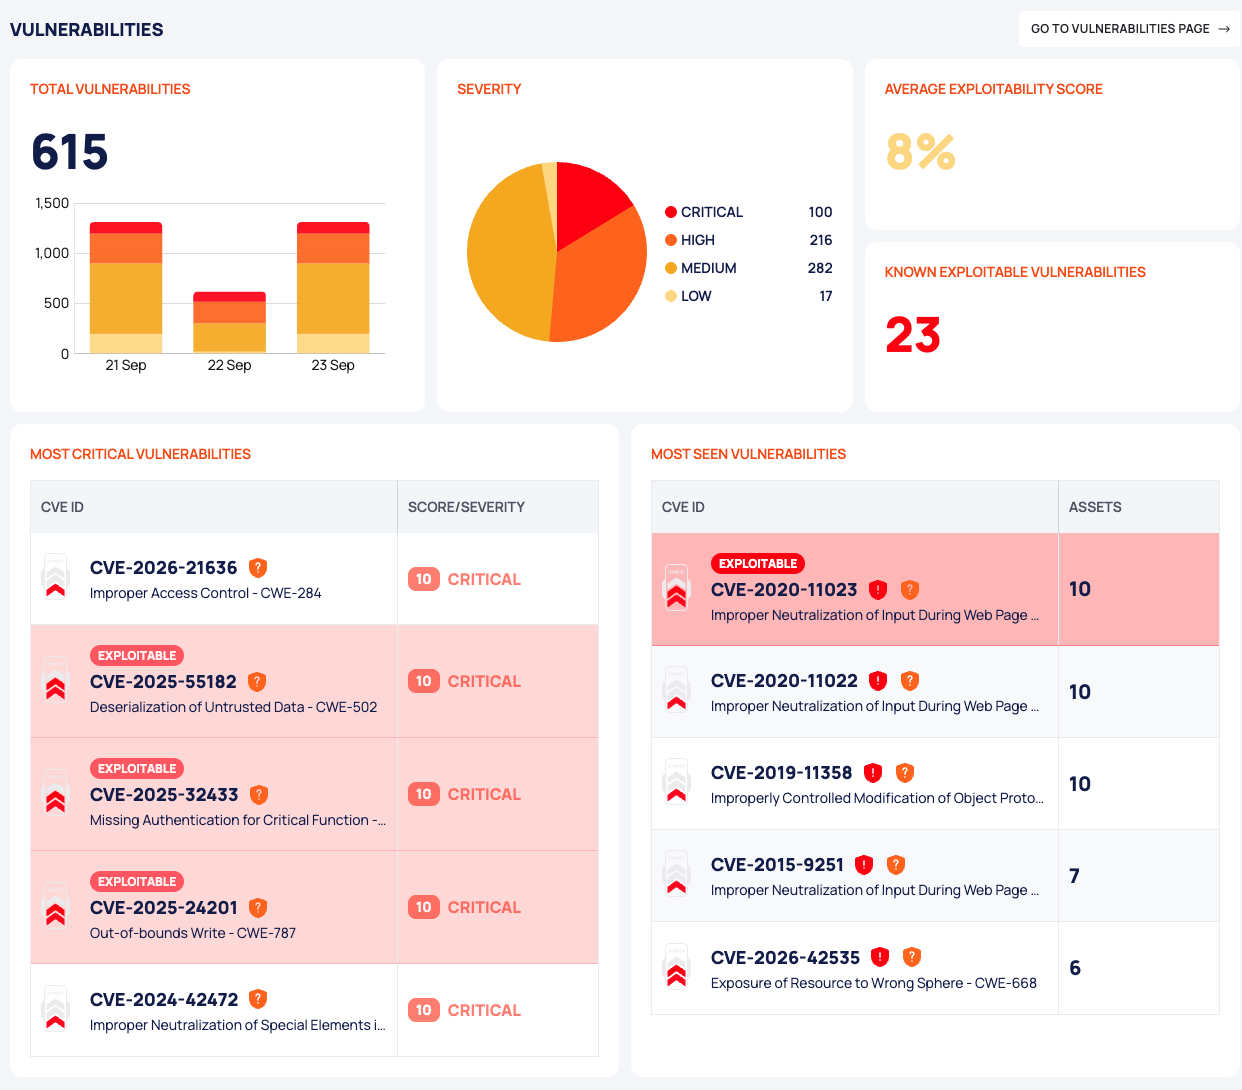
| Card | What it shows |
|---|---|
| TOTAL VULNERABILITIES | Number of vulnerabilities |
| SEVERITY | Vulnerabilities per severity |
| AVERAGE EXPLOITABILITY SCORE | A percentage, colored by band (see below) |
| KNOWN EXPLOITABLE VULNERABILITIES | In red: the number of assets affected by known-exploitable vulnerabilities |
| MOST CRITICAL VULNERABILITIES | CVEs ranked by CVSS base score: CVE ID and SCORE/SEVERITY, with the CWE and, for a CVE in the CISA KEV catalog, an EXPLOITABLE tag |
| MOST SEEN VULNERABILITIES | CVEs that affect the most assets: CVE ID and ASSETS |
GO TO VULNERABILITIES PAGE opens the Vulnerability List. A row opens that CVE's page.
States, Colors and Scores
The dial uses the A to F grades explained in How security scores work.
AVERAGE EXPLOITABILITY SCORE is colored by band:
| Value | Color |
|---|---|
| 1–25% | light yellow |
| 25–50% | dark yellow |
| 50–75% | orange |
| 75–99% | red |
| 99–100% | dark red |
Good to Know
- The dashboard has no filters, date range or export. All charts use daily data.
- The TOTAL ISSUES card at the top counts active issues only. Inactive issues, including the ones you ignored, accepted as a risk, or marked as resolved or as a false positive, are not in it.
- KNOWN EXPLOITABLE VULNERABILITIES counts affected assets, not CVEs.
- The OVERVIEW tabs of Inventory, Issues, Technologies and Vulnerabilities show similar summary cards for their own area.
Do This With the API
- Security score over time: Security Score Timeline
- Asset counts per type over time: Asset Type Stats Timeline
- Issue types with affected-asset counts: Issue Type Stats
- Technology categories: Technology Category Stats
- Known-exploitable vulnerabilities: Vulnerability Known Exploitable Stats
- Average exploitability: Vulnerability Exploitability Score Stats