Triage Issues
The Issue List shows every security issue External Attack Surface Management (EASM) found on your assets. Start with the issue types that are most severe or affect the most assets, then switch to one row per asset to work through them.
Before You Start
- Package: EASM.
- Role: Admin or Member.
- Terms: an issue type is a kind of finding, for example an expired SSL certificate. An issue is one issue type on one asset. The screen says "Issues" for both.
Where to Find It
Sidebar: EXTERNAL ATTACK SURFACE MANAGEMENT › ISSUES · Tab: ISSUE LIST · https://platform.deepinfo.com/app/easm/issues
The EASM dashboard's GO TO ISSUES PAGE and the Global dashboard's TOTAL ISSUES card open it too. Issues has three in-page tabs:
| Tab | What it holds | Deep link |
|---|---|---|
| OVERVIEW | Summary cards (see The OVERVIEW tab) | /app/easm/issues/overview |
| ISSUE LIST | The issues, described on this page | /app/easm/issues |
| INSIGHTS | Resolution, reappearance and false-positive rates, states, categories and fix times; see Issue insights | /app/easm/issues/insights |
Read the Screen
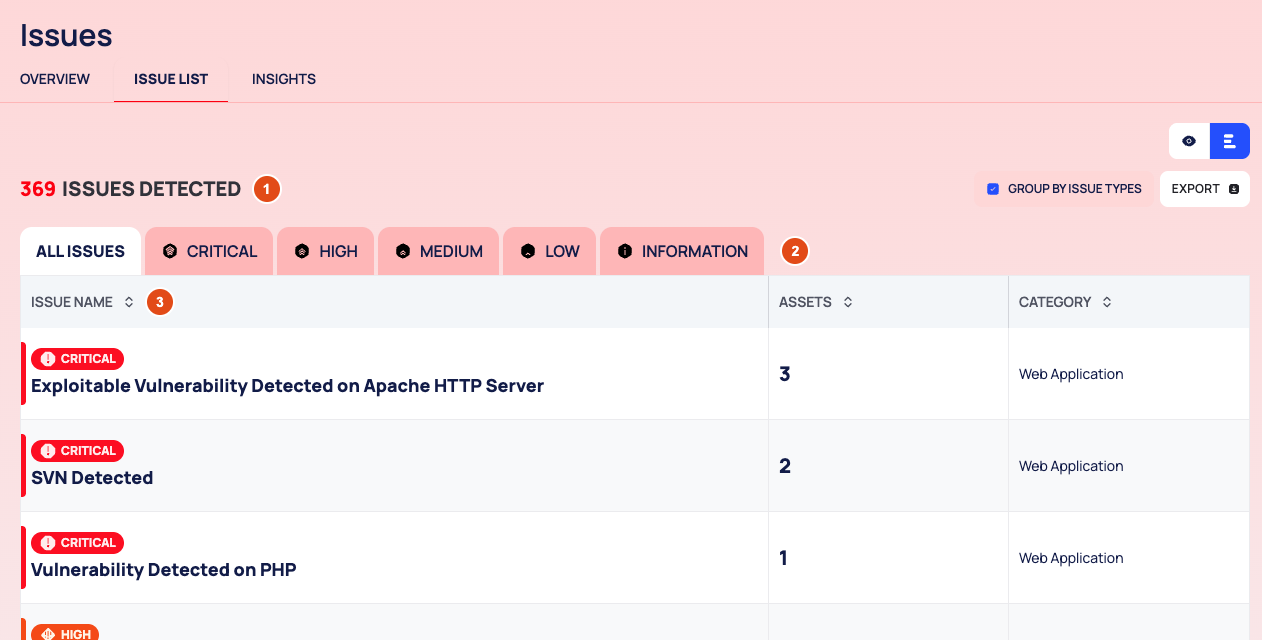
The header breadcrumb reads EASM / ISSUES / ISSUE LIST.
- Result row: the list and quick view icons, the number of issues detected (N ISSUES DETECTED), GROUP BY ISSUE TYPES and EXPORT. When the list is not grouped, the row also has the SEARCH box and the filter chips, SHOW INACTIVES and VIEW SETTINGS.
- Severity tabs: ALL ISSUES, CRITICAL, HIGH, MEDIUM, LOW and INFORMATION. They do not show counts.
- The list. It has two layouts, described next.
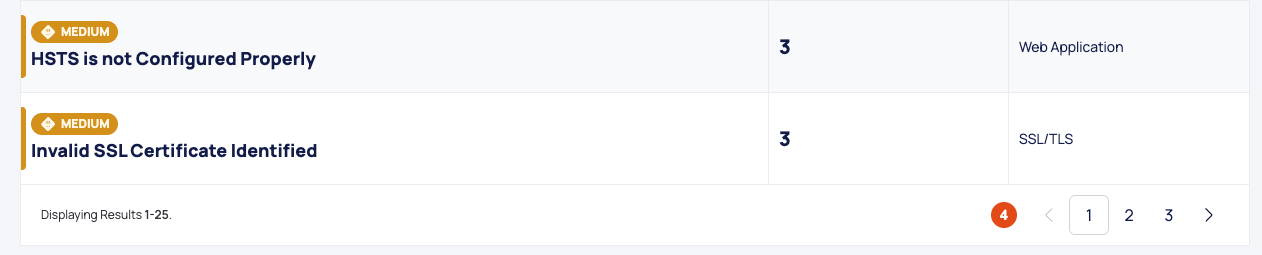
- Pages of 25 rows below the list.
Grouped by Issue Type (Default)
With GROUP BY ISSUE TYPES ticked, each row is one issue type. The list is ordered by severity, then by the number of affected assets.
| Column | What it shows |
|---|---|
| ISSUE NAME | Severity chip and issue type name |
| ASSETS | Number of affected assets |
| CATEGORY | The issue type's category |
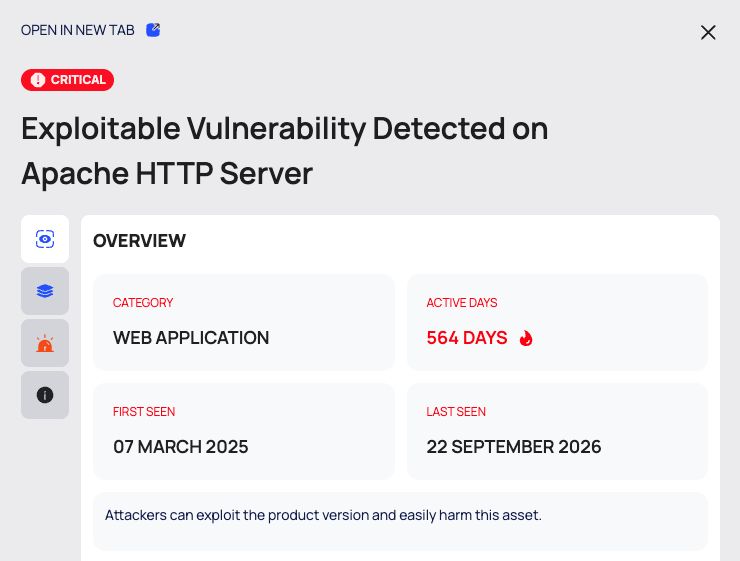
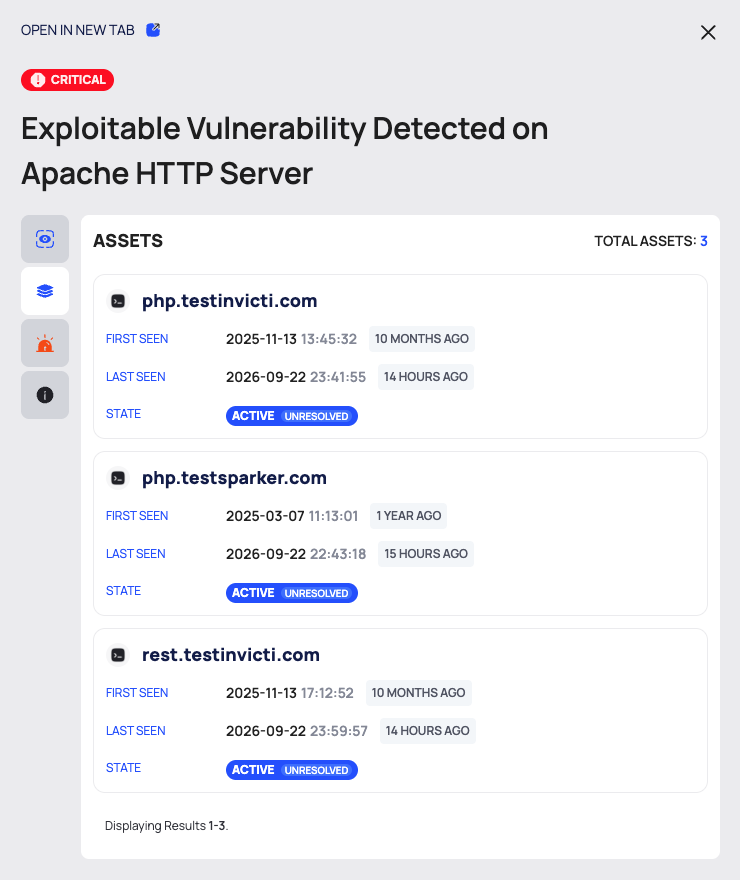
The grouped list has no search, filters or VIEW SETTINGS. Select a row to open the issue type drawer. Its tabs are icons down the side; hover over an icon to see its name:
- OVERVIEW: CATEGORY, ACTIVE DAYS, FIRST SEEN, LAST SEEN, the impact, AVERAGE ISSUE DURATION, AVERAGE FIX DURATION, and STATES: the number of active and inactive issues of this type, with a chart of the active states. For the issue type's score, see the SCORE card on its page (Issue type details).
- ASSETS: every asset with an active issue of this type, with FIRST SEEN, LAST SEEN and its STATE. Select an asset name to open it in a new tab.
- VULNERABILITIES: for issue types about a technology, the known CVEs. Each CVE links to its entry in the Deep Search & Insights (DSI) VULNERABILITY SEARCH, in a new tab.
- ISSUE INFO: DESCRIPTION with External References, REMEDY and CLASSIFICATIONS, the compliance frameworks the issue type maps to, each with its own description.
OPEN IN NEW TAB opens the issue type page, which shows the same issue type across all your assets. Its tabs are OVERVIEW (with the issue type's SCORE and TIMELINE), ASSETS, VULNERABILITIES and ISSUE INFO. On its ASSETS tab you can change the state of each asset's issue. See Issue type details.
One Row per Issue
Untick GROUP BY ISSUE TYPES to list each issue on each asset:
| Column | What it shows |
|---|---|
| ISSUE | Severity chip and issue type name |
| ASSET | The affected asset |
| STATE | The issue's state; select it to change it |
| ACTIVE DAYS | Days between first seen and last seen. After 30 days the value turns red and shows a fire icon |
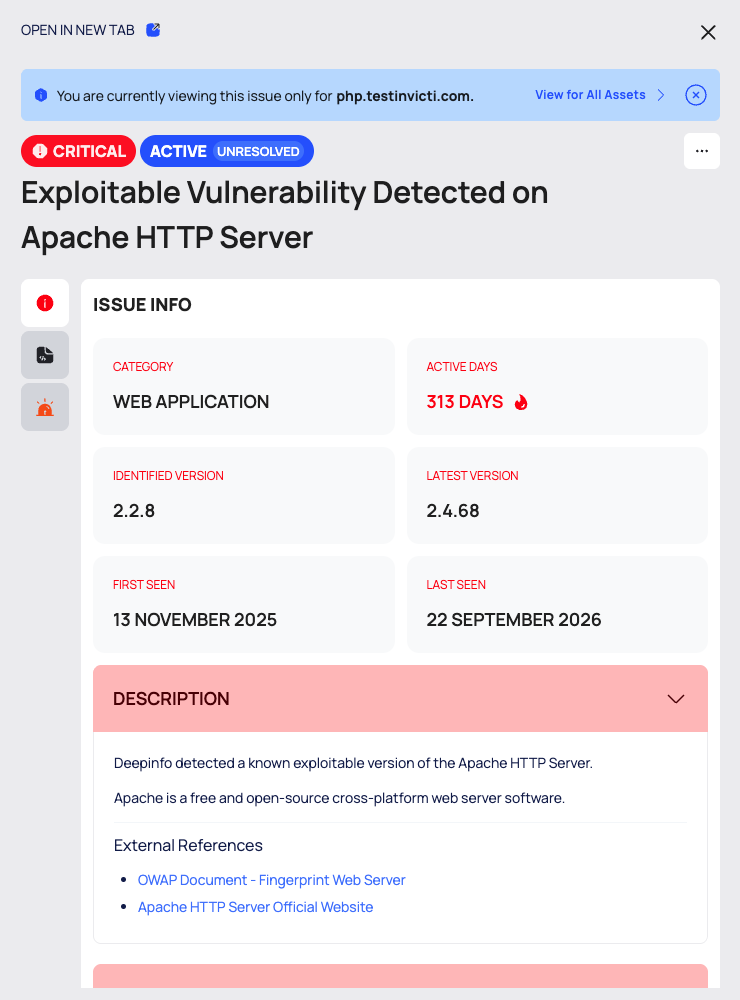
Select a row to open the issue drawer for that one issue:
- A banner says you are viewing this issue only for one asset. View for All Assets opens the issue type page.
- The severity and state chips, and the … menu with CHANGE STATE.
- ISSUE INFO: CATEGORY, ACTIVE DAYS, FIRST SEEN, LAST SEEN, DESCRIPTION with External References, REMEDY and CLASSIFICATIONS, plus details that depend on the issue type, such as IDENTIFIED VERSION and LATEST VERSION.
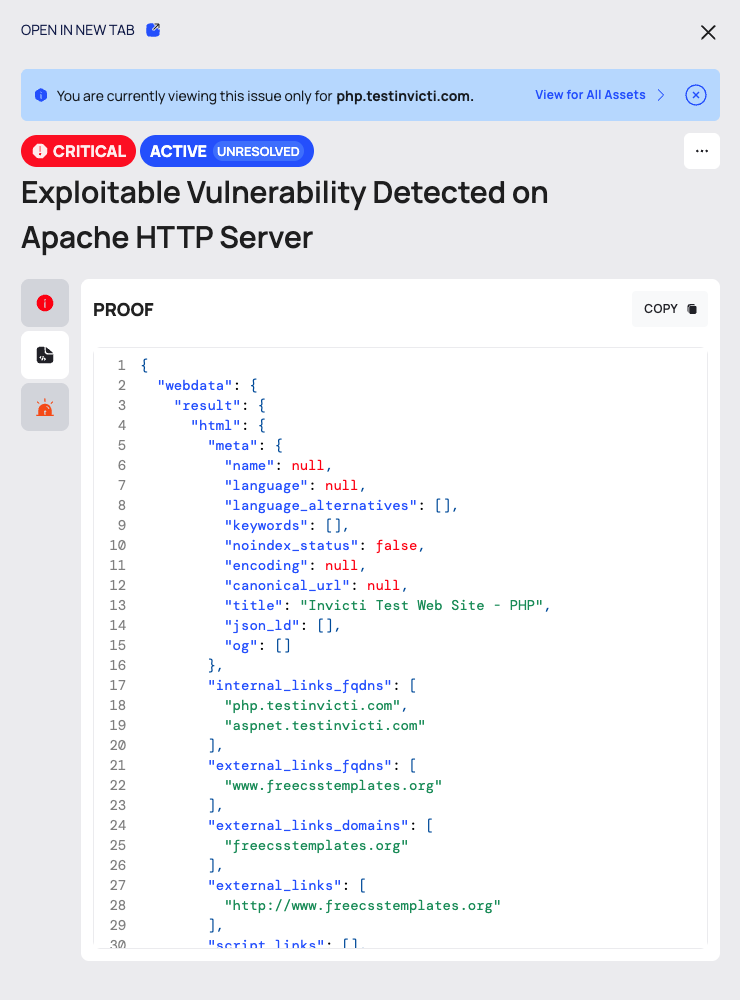
- PROOF: the evidence for the issue, as JSON, with COPY.
- VULNERABILITIES: for issues about a technology, the known CVEs.
OPEN IN NEW TAB opens the issue on its asset's page (see Investigate an asset).
Triage the List
Pick a severity tab, starting with CRITICAL.
In the grouped list, the issue types at the top are the most severe and affect the most assets. Open a row to read the impact and the remedy.
Untick GROUP BY ISSUE TYPES to work issue by issue. SEARCH and the filter chips now appear.
Narrow the list with the filter chips: ISSUE, CATEGORY, SEVERITY, ASSET, ASSET TYPE, FIRST SEEN DATE, LAST CHECK DATE, LAST SEEN DATE and STATE. For example:
- SEVERITY offers Critical, High, Medium, Low and Information.
- ASSET TYPE offers Domain, Subdomain, IP Address and Website.
- STATE offers every state, such as Active - Newly Detected or Inactive - Risk Accepted.
- The date chips take an AFTER and a BEFORE date.
SEARCH matches the issue name.
To order the list, open VIEW SETTINGS › Sort By and pick a field, such as Issue Severity, Asset Name, First Seen Date or Issue Type Name, and a direction. Result Per Page sets the page size.
Change states as you decide. See Change the state of issues and vulnerabilities.
A filter chip opens a popover with the rule (Must, Must Not or Should), an operator and the Value, plus Add New, Clear All, CANCEL and APPLY. The rules work as in the API; see Search & filters. When nothing matches, the list shows No Result Found.
See Inactive Issues
The ungrouped list shows active issues by default. Tick SHOW INACTIVES to include inactive issues too, such as the ones you ignored, accepted as a risk, or marked as resolved or as a false positive.
Export Issues
- Select EXPORT. The DOWNLOAD dialog opens.
- Choose the RECORDS: ALL exports every issue, of all severities, active and inactive, whatever tab you are on. FILTERED is offered only in the ungrouped list; it exports what the list shows, with the severity tab, SHOW INACTIVES, your filters and your sort.
- Choose the FILE FORMAT, CSV or JSON, and select DOWNLOAD.
For the other options in the dialog, see Browse your asset inventory.
Quick View
Select the quick view icon to browse issue types by category on the left. The right side shows the selected issue type, with OPEN IN NEW TAB and the tabs OVERVIEW, ASSETS, VULNERABILITIES and ISSUE INFO. Quick view always groups by issue type, so filters are hidden.
The OVERVIEW Tab
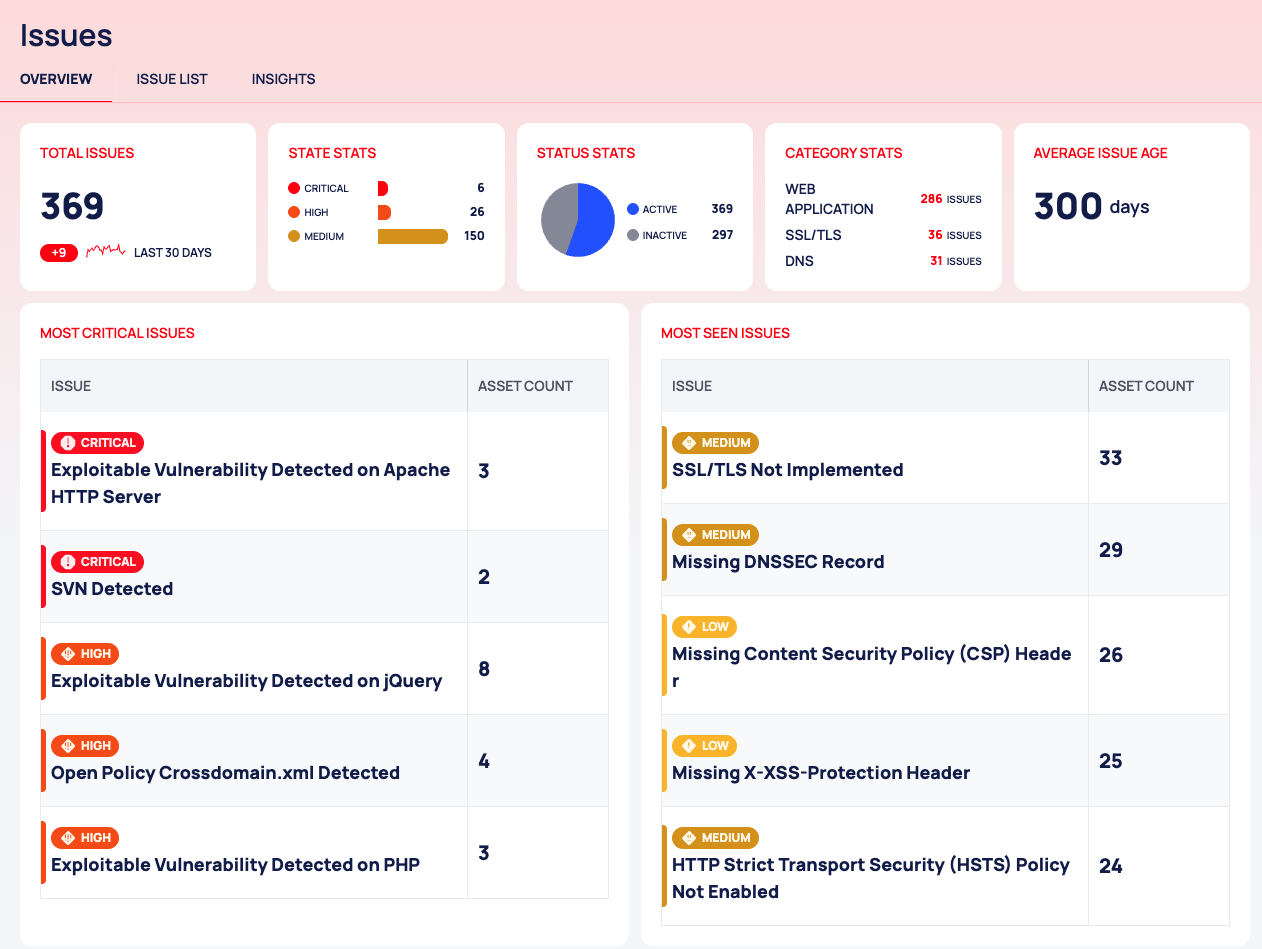
| Card | What it shows |
|---|---|
| TOTAL ISSUES | Active issues, with a change chip and LAST 30 DAYS |
| Severity card | The number of issues for the severities CRITICAL, HIGH and MEDIUM |
| STATUS STATS | ACTIVE and INACTIVE issues |
| CATEGORY STATS | Issue categories, largest first |
| AVERAGE ISSUE AGE | In days |
| MOST CRITICAL ISSUES | ISSUE and ASSET COUNT |
| MOST SEEN ISSUES | ISSUE and ASSET COUNT |
For the counts of every severity, see the SEVERITY chart on the INSIGHTS tab, or the SEVERITY card on the EASM dashboard.
States, Colors and Scores
| Severity | Color |
|---|---|
| CRITICAL | red |
| HIGH | orange |
| MEDIUM | yellow |
| LOW | light yellow |
| INFORMATION | light blue |
For the states, see Change the state of issues and vulnerabilities. For the A to F grade, see How security scores work.
Good to Know
- ACTIVE DAYS is the time between the first and the last time the issue was seen, not its age today.
- VIEW SETTINGS (sorting, page size and columns) is available only in the ungrouped list.
Do This With the API
- Search issues: Issue Search
- Get one issue: Issue Detail
- Issue types with affected-asset counts: Issue Type Stats
- Export as CSV or JSON: Issue Export